This post provides a deeper look into the ideas of the Continuous Improvement Cycle, one of JumpRope’s Core Values, from the perspective of a building or district leader.
As a building administrator, and then later as a district curriculum coordinator, I was always looking at data. State testing data, as well as the host of standardized, benchmarking assessment data that I had access to, provided me a way to investigate how we, the school or district, were doing. As I combed through the data, looking for trends in student performance, I continually asked myself questions like:
-
- Why do students who appear to be strong, based on teachers’ comments and progress reports, perform poorly on standardized measures?
- Why do certain cohorts of students appear to be weak some years and stronger others?
- Why are students consistently underperforming in certain areas even though we have highlighted that content area as a priority in our intervention and instruction?
I knew to answer these questions I needed a way to look at classroom performance data, but it wasn’t particularly helpful to look at year end, aggregate course grades.
The transition to standards-based assessment was a true game changer. It gave me classroom data that reported student learning by specific targets aligned to standards, not just quarterly or yearly aggregate scores.
The transition to standards-based assessment was a true game changer. It gave me classroom data that reported student learning by specific targets aligned to standards, not just quarterly or yearly aggregate scores. Since we tracked classroom data according to the same standards as those the standardized assessments were measuring, I could begin to explore answers to the questions like those above.
For example, if a student appeared to do much better on classroom assessments than on standardized tests we could consider a variety of possible reasons. If classroom data was showing that the student was not a consistent performer, perhaps the high-stakes, “one and done” test caught the student on a bad day. Or, like Sara mentioned in Using Data to Revise Plans, we could reflect on our practice and choices. In this case we could consider whether our learning targets were focusing on the key dimensions of the standard, and at the right level of demand. We could ask ourselves “do we need to ‘beef’ them up?” We could also examine our assessment practices to be sure we were assessing what we thought we were assessing. Similarly, if cohorts of students had inconsistent performance from year to year on standardized measures, we could use classroom data to help us explore if we had placed our learning targets at the right grade or course level.
As an administrator who planned professional development and supported implementation of instructional initiatives, I was always eager to see if our choices had been effective. That is, I wanted to see improvement for our students as a result of the efforts and resources we had expended. Yearly standardized tests did not give me particular insight as to whether our PD on building early readers’ phonemic awareness was working. However, once we started using JumpRope and tracking student progress over time according to specific targets, it was much easier to identify growth and improvement. This type of detailed classroom level information made for a much richer data set to understand how we were doing as a school or district.
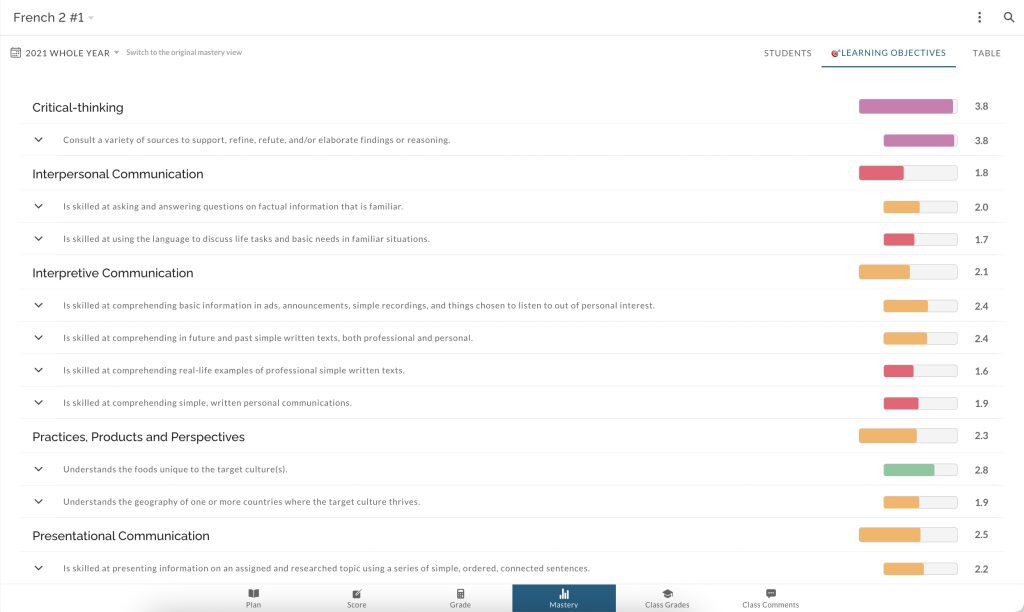
Once we started using JumpRope and tracking student progress over time according to specific targets, it was much easier to identify growth and improvement.
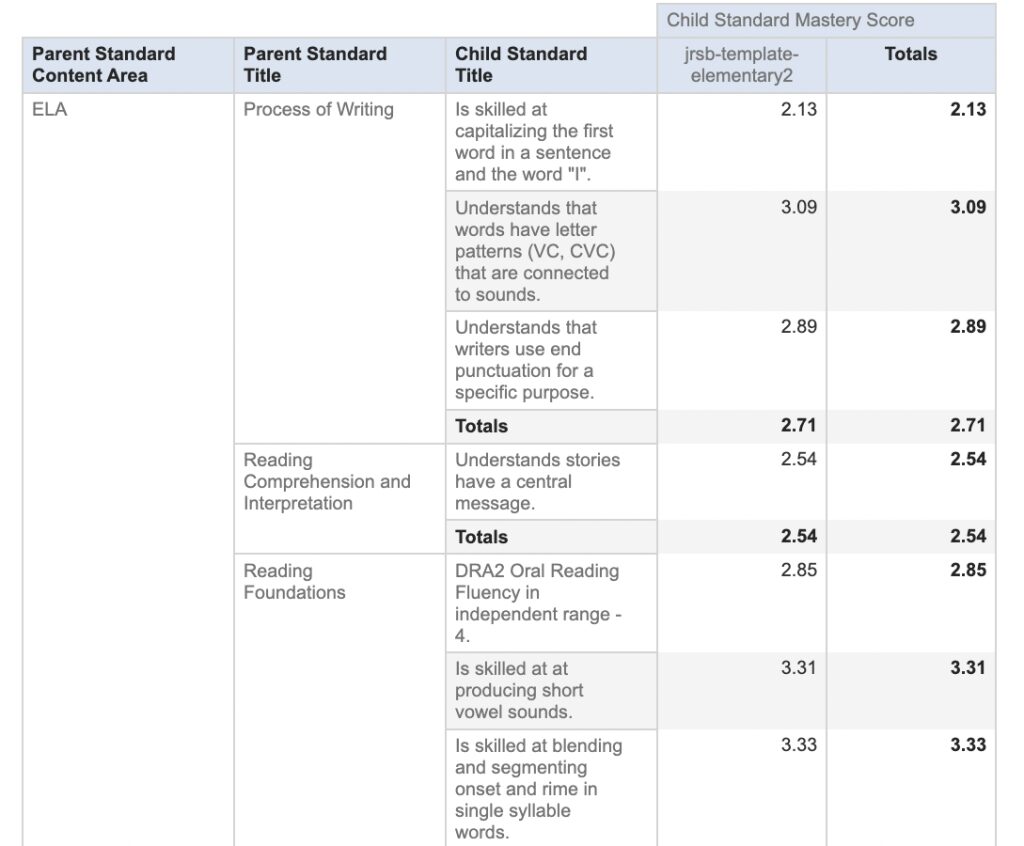
By reviewing data by standard and target, we were also able to identify places where our instructional practice could be improved. Using mastery data from the classroom allowed us to plan and deliver differentiated professional learning for our teachers. As an example, we reviewed the range of scores given across classrooms for certain targets in middle school math which revealed that we needed to calibrate our understanding of what it meant to be proficient. Grade level teams spent their PLC time writing success criteria for each level of mastery for the targets that had the greatest discrepancies in student scores across classrooms. As teachers came to agreements on what a student’s work would look like for each score, they had rich conversations about lesson planning, instructional choices, and assessment.
The mastery data in JumpRope was invaluable to teachers and administrators when it came time for teachers to write Student Learning Objectives (SLO) as part of their professional evaluation process. Together an administrator and a teacher could review the performance of the teacher’s class from previous years on standards relevant to the standards the teacher would be working on with current students. They could easily group students into those who needed more support to meet the standard, those who were likely to meet it with the planned classroom instruction, and those who would need additional challenge because they were already on target to meet the standard. No longer did an administrator and teacher have to wait until the following year when the state testing results were released to reflect on the teacher’s instructional choices. After the period of instruction they could review the classroom data and discuss what professional growth activities might be most beneficial for the teacher.
Having more specific data on student performance for each target in JumpRope made it possible for our administrative team to consider classroom data in conjunction with standardized test results. Equipped with a more complete picture of student performance we were able to monitor the effectiveness of programs, plan specific professional development, and support teachers in their evaluation process.