
We’ve learned through decades of research that supporting students in effective goal setting increases their sense of agency, motivation, and achievement (Cauley & McMillan, 2009).
This post on student goal setting provides some context and a research base for why we should support our students in setting goals. It helps us see that a crucial tool in goal setting is using data.
How does the JumpRope software support you in this process?
One might argue that a traditional report card provides students with data for goal setting, but if we adhere to the notion of SMART goals, as delineated in the blog post linked above, we see that a JumpRope progress report provides more actionable data than a traditional report card does.
In SMART, the S refers to Specific and the M refers to Measurable. The data generated with a JumpRope progress report are intentionally designed to help narrow the focus and therefore support setting goals that are specific and measurable.
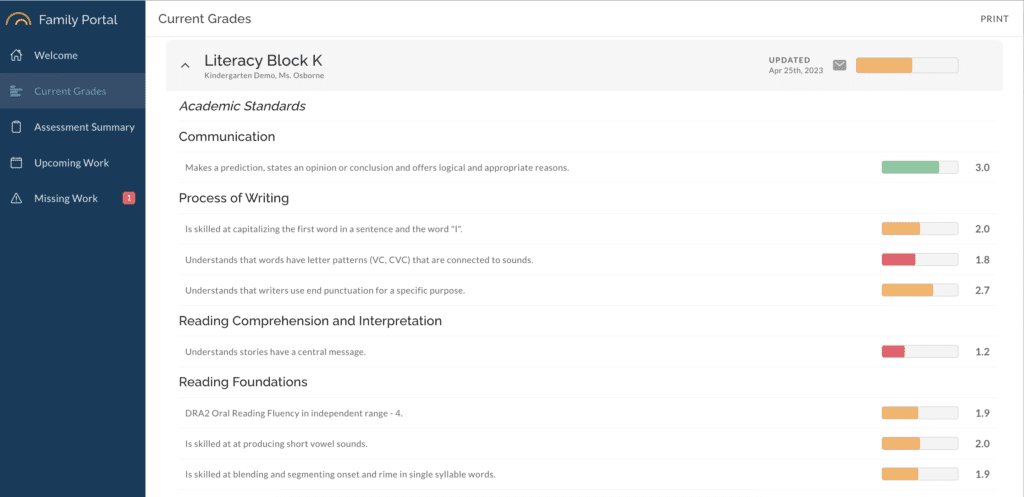
Let’s look at some student data as we’d see it in JumpRope. The first image below is of Hugolina’s progress report, a snapshot of data collected up to a certain point. The second image is the portal view for Hugolina and her family.
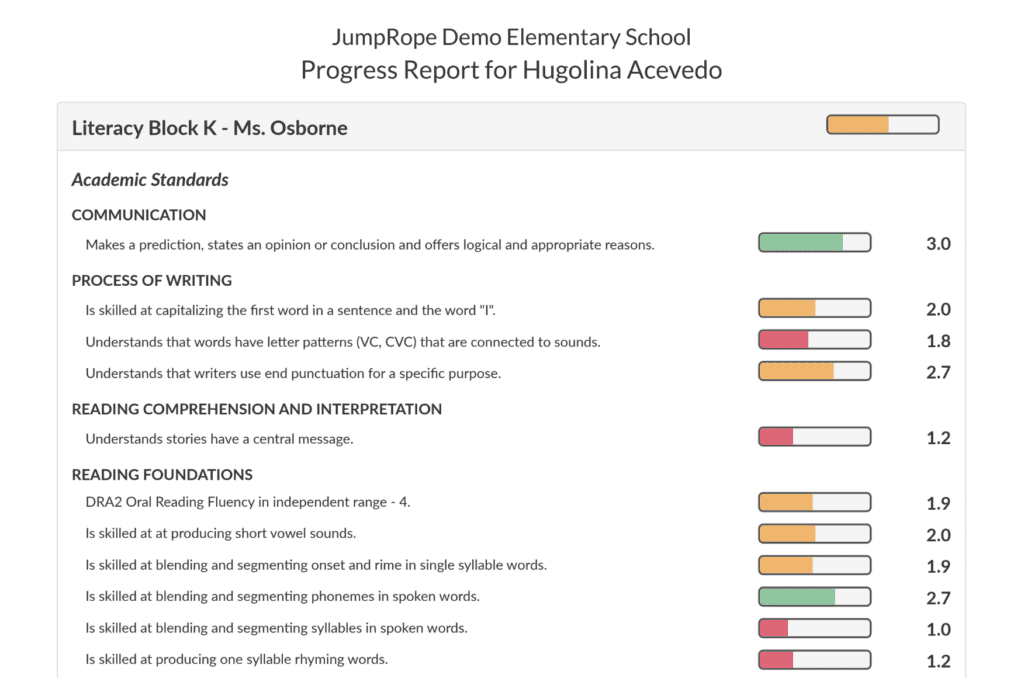
We see that for Literacy, her overall academic mastery is reported for Communication, Process of Writing, Reading Comprehension and Interpretation, and Reading Foundations. We also see that each of those categories is further delineated by the learning targets nested below them.
In Process of Writing, helping Hugolina set and work toward a goal of capitalizing the first word in each sentence and the word “I” is more specific and easier to measure than would be a goal to improve in the process of writing or in literacy in general.
Teachers have lots of options for planning lessons to support students in using these data to set goals. This is where understanding the two views pictured above is helpful:
- The teacher might spend time with a group of students looking at progress reports to help them recognize and interpret what they are looking at.
- She might point out the variation in numbers and colors as displayed on the report to help students find areas that need improvement.
- She might work with individual students to help them consume their own data and set goals.
- The teacher could also use this time to help students understand how to interpret their data as seen in the portal and know that data is live so they can track it regularly rather than waiting for the next progress report.
In Summary
In any case, JumpRope makes this data available to teachers and students so teachers can help students look at the data to set SMART goals.
If you are interested in seeing how to generate a progress report in JumpRope, take a look at this help doc. If you’d like to read more about student goal setting, take a look at this blog post.
Want to learn more about how JumpRope can help you in this process? Reach out today.